
San Diego County Housing Report: The Temperature of the Market, April 2, 2024.
George Lorimer - 619-846-1244
Your Home Sold Guaranteed, or I'll Buy It!*
ProWest Properties, DRE# 01146839, *Conditions apply.
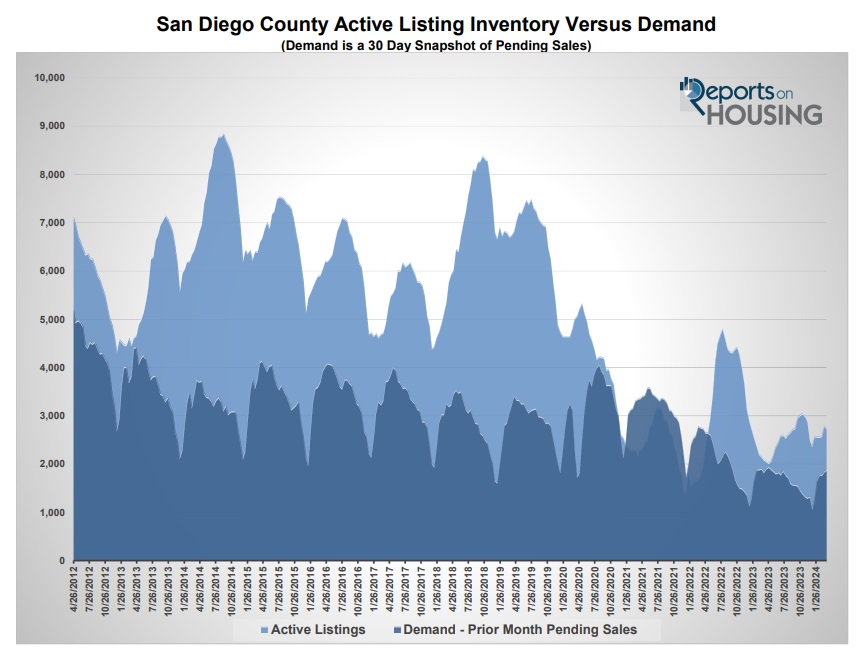
Comparing today’s inventory and demand levels to prior years reveals the accurate temperature and trends of the current market.
Low Inventory and Demand - Even with low demand, the low inventory has paved the way for a very hot Spring Market.
Download graphs
There are plenty of weather apps and websites to try to figure out the temperature when planning the day. Based on the information, it may be helpful to pack a jacket or wear shorts. Unfortunately, with all the technology, weather forecasting is not an exact science and often misses the temperature by a mile. It is better to look at a good old-fashioned outdoor thermometer, or the “outside temperature” reading in the car, to gauge the day’s weather accurately.
Get your Instant Home Value
Similarly, there is no shortage of “economic experts” who look at housing data and attempt to measure the current temperature of the market. Yet, many of these experts are not “housing analysts” by trade and miss the temperature of housing by a mile, unfamiliar with the nuances in the data. Their economic expertise focuses on a different sector of the economy. To accurately determine housing’s strength and its actual temperature, it is best to turn to the data, inventory versus demand.
Ever since rates spiked higher in 2022, there has been a tug-of-war between two opposing forces: supply scarcity and an affordability crisis. The lack of homes available to sell favors sellers in the negotiation process, and home affordability dropping to historic lows favors buyers in the negotiation process. As rates spiked higher from 3.25% in January 2022 to eclipsing 7% in October 2022, the highest rate in over 20 years, demand came to a screeching halt, and the inventory climbed. The October 2022 inventory reached 4,433 homes, and demand, a snapshot of the number of new pending sales over the prior month, dropped to 1,596.
Search available homes
The difference between supply and demand reached 2,837. In March 2022, when home values were rocketing higher, the inventory was at 1,702, and demand was at 2,785. Demand exceeded supply. From June 2020 through May 2022, the difference between supply and demand was either low or negative. This rare phenomenon resulted in massive home value appreciation for two years. That all ended once rates eclipsed 6% in June 2022 and continued its march higher.
To get a full copy of the report, click here.
Our membership allows us to provide free copies to consumers, clients, and past clients. But not real estate licensees and affiliates. They have to buy their subscription.
George Lorimer - 619-846-1244
Your Home Sold Guaranteed, or I'll Buy It!*
ProWest Properties, DRE# 01146839, *Conditions apply.
Comparing today’s inventory and demand levels to prior years reveals the accurate temperature and trends of the current market.
Low Inventory and Demand - Even with low demand, the low inventory has paved the way for a very hot Spring Market.
Download graphs
There are plenty of weather apps and websites to try to figure out the temperature when planning the day. Based on the information, it may be helpful to pack a jacket or wear shorts. Unfortunately, with all the technology, weather forecasting is not an exact science and often misses the temperature by a mile. It is better to look at a good old-fashioned outdoor thermometer, or the “outside temperature” reading in the car, to gauge the day’s weather accurately.
Get your Instant Home Value
Similarly, there is no shortage of “economic experts” who look at housing data and attempt to measure the current temperature of the market. Yet, many of these experts are not “housing analysts” by trade and miss the temperature of housing by a mile, unfamiliar with the nuances in the data. Their economic expertise focuses on a different sector of the economy. To accurately determine housing’s strength and its actual temperature, it is best to turn to the data, inventory versus demand.
Ever since rates spiked higher in 2022, there has been a tug-of-war between two opposing forces: supply scarcity and an affordability crisis. The lack of homes available to sell favors sellers in the negotiation process, and home affordability dropping to historic lows favors buyers in the negotiation process. As rates spiked higher from 3.25% in January 2022 to eclipsing 7% in October 2022, the highest rate in over 20 years, demand came to a screeching halt, and the inventory climbed. The October 2022 inventory reached 4,433 homes, and demand, a snapshot of the number of new pending sales over the prior month, dropped to 1,596.
Search available homes
The difference between supply and demand reached 2,837. In March 2022, when home values were rocketing higher, the inventory was at 1,702, and demand was at 2,785. Demand exceeded supply. From June 2020 through May 2022, the difference between supply and demand was either low or negative. This rare phenomenon resulted in massive home value appreciation for two years. That all ended once rates eclipsed 6% in June 2022 and continued its march higher.
To get a full copy of the report, click here.
Our membership allows us to provide free copies to consumers, clients, and past clients. But not real estate licensees and affiliates. They have to buy their subscription.
We would like to hear from you! If you have any questions, please do not hesitate to contact us. We are always looking forward to hearing from you! We will do our best to reply to you within 24 hours !