San Diego Real Estate Market Commentary May of 2019
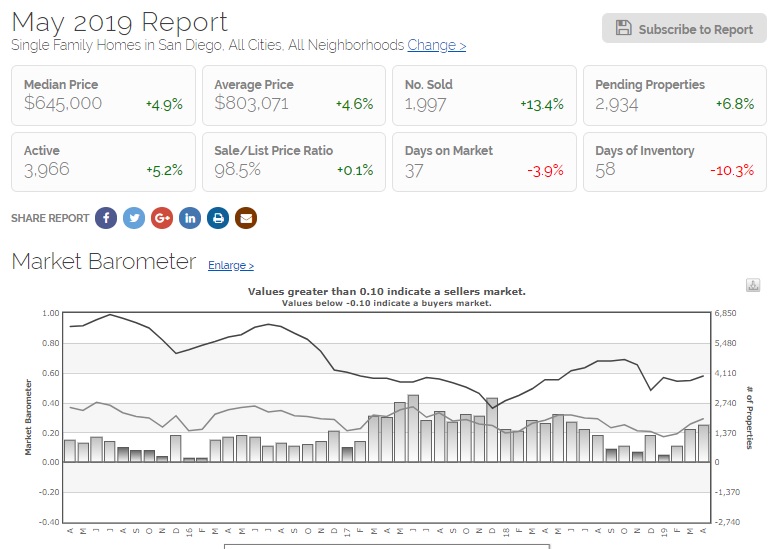
Home Sales Up in Apr 2019 Sales increased 13.4% from the month before and were up 2.5% year-over-year. Get Your INSTANT and FREE Home Value (click here)
Prices improved in Apr 2019 with the median price climbing 4.9% from the previous month, up 2.2% compared to last year.
Search for homes (click here)
The average price rose 4.6%, a yearly loss of 0.8%. Inventory rose 5.9% from last month and was up 4.1% year-over-year.
All the San Diego Neighborhoods Stats and Graphs (click here)
Call George Lorimer and Start Packing 619-846-1244
All of our services are 100% Guaranteed or cancel the listing and pay nothing (click here for free report)
The median sales price for single-family, re-sale homes rose 4.9% from March. The average sales price was up by 4.6%. Year-over-year, the median sales price rose 2.2%, while the average sales price fell by 0.8%.
Home sales, meanwhile, were up 13.4% from March. Year-over-year, home sales were up 2.5%, breaking a twenty-five-month streak in which sales of single-family homes were lower than the year before.
Days on Market, or how long it took from when a home was listed for sale to when it went into escrow, was thirty-seven last month. The average since January 2001 is fifty-seven days. The sales price to list price ratio was 98.5%. The National Association of REALTORS® considers a ratio of 95% to indicate a balanced market.
Although inventory continues to be abysmal, it has increased, year-over-year, for the past eleven months in a row. It is still less than one-half the average since 2001. As of the 10th of May, there were 3,966 homes for sale. We average 8,515!
This is reflected in our Days of Inventory statistic which is fifty-eight for homes. The average is one-hundred and forty-four.
The median sales price for resale condominiums was down 1.4% year-over-year. The average price fell 4.9%.
The sales price to list price ratio for condos was 98.9% last month.
Condo sales were down 6.5%. Condo sales have been lower than the year before twenty-one of the past twenty-two months.
Condos are selling in thirty-two days, the average is fifty-five days.
Condo inventory is at 1,695 units for sale. The average is 3,460.
There are fifty-two Days of Inventory for condos. The average is one-hundred and thirty-two.
If you would like to know what’s going on in your neighborhood, visit my online report and click on Recent Sales & Listings. That will tell you what is for sale and what has sold.
If you would like to know what’s going on in your neighborhood, visit my online report and click on Recent Sales & Listings. That will tell you what is for sale and what has sold.
You can visit my online report at http://lorimer.rereport.com
We would like to hear from you! If you have any questions, please do not hesitate to contact us. We are always looking forward to hearing from you! We will do our best to reply to you within 24 hours !

